Showing posts with label infographic. Show all posts

Tuesday, March 15, 2016

Instagram Users Consume A Lot Of Music

Nielsen just completed a new study assessing Instagram user's music behaviors, and discovered a number interesting facts.

It turns out that Instagram users are above average music consumers. They spend more time listening, and they spend more money on music items than other music consumers for starters. They also take artist's live performances more seriously than most other music consumers.

Their tastes in music is also different, as they listen to more pop, hip-hop and R&B than other music consumers (check out the chart below).

They're also more than twice as likely to pay for a premium streaming tier than other users.

The upshot: if you're not on Instagram already, it's time to sign on, as there are a lot of music fans there.


Thursday, February 25, 2016

Maybe Piracy Hasn't Gone Away After All

Just when you thought music piracy was over comes this study from Music Watch which claims that there are more people stealing music than ever.

Most studies contradict this notion (which is what I believe myself), but the following infographic takes an interesting look at the situation. It's short on data, but this article does give a lot more detail.

Note that it was also published a year ago, and the streaming world has certainly gone up a notch since then.


Thursday, December 31, 2015

Why People Still Buy CDs

Why people buy CDs imageIf you read the news at all, you probably think that the CD format is dead and buried, but that's far from the truth.

Last year there were more than 170 million CDs sold in the United States alone that could be counted. No one knows exactly how many were actually sold, since so many sales (like direct sales at gigs and online from an artist's website) are under the Soundscan radar.

But as we've recently seen from Adele, there's a large audience out there that will happily buy a CD, sometimes even along with streaming the same music online.

The following graphic from a recent BPI report shows the reasons why many people continue to buy and use CDs.


Thursday, December 3, 2015

The Evolution Of Online Video

The evolution of video
Believe it or not, online video is only about 10 years old, and as we all know, it's come a long way in that time.

Just about everyone has posted a video and many are actually making money doing so. And online video cuts across all age demographics, so even though younger Americans are more prolific, the 50+ year-olds watch more video online than ever before.

Here's a great infographic from SwitcherStudio that shows just how much things have changed since YouTube was created 10 years ago.

Online Video Evolution infographic


Wednesday, November 4, 2015

5 Qualities Of A Memorable Post Graphic

Brain Memory
When you post to Facebook or Twitter, your engagement goes up about 30% or more (depending upon the study you read) if you add a graphic. The problem is that most graphics aren't that compelling, so the effect is diminished.

It turns out that a picture isn't exactly worth a thousand words as the old adage says. In fact, it's worth exactly 84.1 words, which is the number of words it takes people to describe an image, according to cognition expert Alan F. Blackwell. That said, visuals are much more memorable than words, which is why it's best to take care when choosing one.

There's a great article on thenextweb that describes this in more detail, but here are the 5 qualities of a memorable graphic in a nutshell.
1. Harmonious colors. Colors schemes that are natural and work together are the most memorable. 
2. People expressing emotion and interacting. Some objects can also be memorable, but landscape images are largely forgettable. 
3. Prior knowledge of the subject. Aesthetically pleasing images aren't very memorable. 
4. Infographics are memorable, but graphs aren’t. Musicians aren't likely to do many graphs though, and that's a good thing. 
5. Multiple images reinforces the point. In other words, a variety of images is better than just a single image.
The graphic on the left incorporates 3 of the 5 qualities just mentioned. The colors are harmonious, we all know what a brain looks like so there's prior knowledge, and there are multiple images (the brain overlaid with the skull x-ray). It's perhaps not the best example of the ideal graphic, but it does capture your attention.

This is something that I'm going to be placing more emphasis on in the future, and perhaps it's something that you should consider in your posts as well.

Wednesday, August 5, 2015

Here's Where To Put Your Social Media Promotion Energy

Snapchat image
I'm frequently asked the question of which social networks to concentrate on, and the answer is a moving target. Social networks tend to trend and wane, and we're see that right now with two of them.

Take a look at the following infographic by WebpageFX. It shows that Twitter is stagnant at best while Snapchat is quickly on the rise, as is Instagram. Of course, Facebook is still the 800 gorilla of social media but you have to pay for most of your exposure these days.

If I were just starting fresh with my social media promotion, Snapchat would be high on the list of networks to concentrate on, followed closely by Instagram.


Wednesday, July 22, 2015

Most Music Discovery Still Happens Traditionally

It's very easy to believe that good social media promotion will get your name out there, and it certainly will, but when it comes to having your music heard there's still nothing like traditional media.

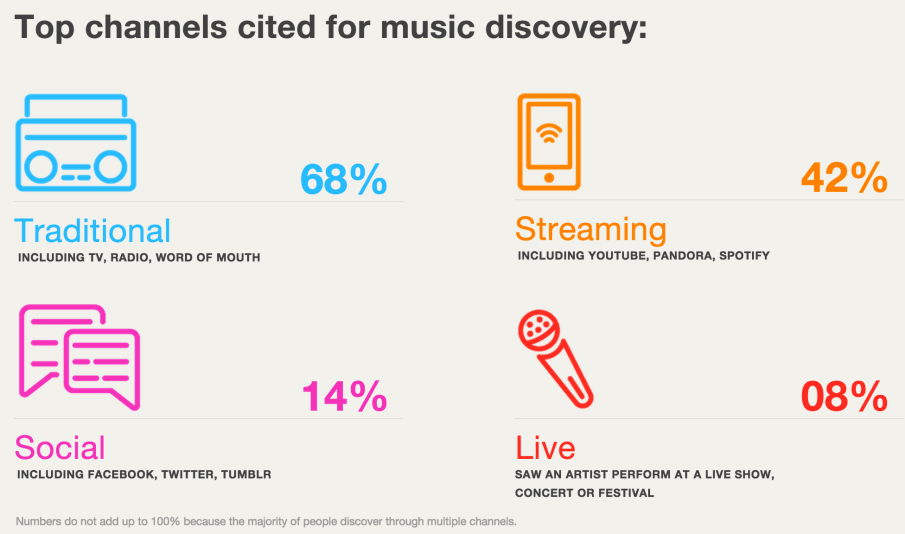
According to a new study by EvenBrite, most people still discover new music through traditional means like radio, television and word of mouth at 68%. Streaming came next at 42%, while social was way down at 14%. Live was even worse at only 8%.

This study corresponds with others in that radio still comes out #1 for music discovery, although YouTube seems to be catching up (at least for the moment).

Streaming does have another huge positive effect though. 51% of people that buy tickets to concerts do so because they discovered the act on a streaming service.

Music Discovery Channels

Monday, July 13, 2015

Everything You Need To Know About Hashtags

Here's a great infographic from SocialCaffeine.com about Twitter hashtags. I've posted a lot about them here in the past, and this graphic reinforces that info.

Pay attention to the bottom right hand corner - the Where To Find Popular Hashtag section. It has some great suggestions about where to find find the right hashtags for your content (remember that what you post doesn't always have to use #musicians, #music, #studio, etc.).


Thursday, July 9, 2015

How Much Is A Music Stream Actually Worth?

There's a lot of confusion in the marketplace about how much a music stream is worth. To say that it's a complicated issue is an understatement.
  • It depends upon all of the following factors:
  • What type of service (interactive like Spotify, or non-interactive like Pandora)
  • Which tier (free or paid subscription)
  • Which territory it's played in (they all pay different royalty rates)
  • Your marketshare (on Spotify you get paid more if you get played more)
As you can see, it's impossible to say exactly what each stream is really worth, and the best we can do is get an average. Billboard has done just that with a great infographic that gives you an approximate worth of a stream coming from Spotify and Pandora.

Value of a Music Stream image


Friday, July 3, 2015

A Look At The Crowded Streaming Marketplace

Apple Music launch this week moves it into an already crowded streaming marketplace. This Edison Research survey (the chart was put together by Statista) shows that Pandora has a commanding lead in the US over all other streaming services.

It's important to remember that Pandora isn't available in most of the rest of the world, so Spotify basically has matched its user numbers if you look at it globally.

Apple Music hopes to be at the top of the food chain within a year though, and actually has a shot at it despite the tepid launch thanks to its hardware user base and the 850 million credit cards currently on file.


Monday, June 29, 2015

A Look At Label Exec Salaries

I bet you always wondered exactly how much those label execs at your record company are making. Here's an interesting chart thanks to Billboard that gives some real-world numbers. Caution: if you're in debt to your label, you might not like what you see.


Monday, June 15, 2015

A Look At The Streaming Revenue Pie

Here's an interesting infographic from Statista that shows exactly what the online digital revenue pie looks like as compared to 2008.

At the end of 2014 there was about 28 million paid streaming music subscribers, which has now topped 41 million so the numbers are quite a bit larger in 2015.

As you can see, downloads still owns 52% of the market, and while that will undoubtedly decrease in 2015, it will still remain a substantial piece of the puzzle for at least a few more years.

What is growing is the number of people that are adopting streaming, either via the free tier or paid subscription, and this looks to really take off now that Apple Music has launched.

What's interesting is that 15% of the market is still made up of ring tones, ring backs and various other technologies that we don't even consider these days, but are still generating significant income.

Infographic: Why Everyone Wants a Piece of the Streaming Pie | Statista
You will find more statistics at Statista


Thursday, March 19, 2015

The Generation Gap In Music Streaming

Generation Gap image
It's been said that statistics can be presented to reach any conclusion that you want and that's true to some degree. While a chart or graph might show one thing, it may overlook or ignore the real reason the result is happening.

Take for instance this infographic from Statista that shows the generation gap of the users of streaming music. The information comes from Edison Research's annual survey called The Infinite Dial and shows that Baby Boomers are way behind the curve when it comes to streaming adoption, as opposed to 12 to 24 year olds.

What the chart doesn't take into account is that 12 to 24 is the prime age for music consumption. 25 to 54 is when people are starting families and working and therefore have less time for music in general, while people ages 55+ typically consume far less music in general because of other interests.

The point is if you look at any area of music consumption, you'll find the same general breakdown.

A couple of things about this chart that are interesting though:

1. All age groups use Pandora much more than than the on-demand Spotify service.

2. More people use iTunes Radio than generally believed.


You should follow me on Forbes for some insights on the new music business, Twitter and Facebook for daily news and updates on production and the music business.

Friday, March 6, 2015

The Most Popular Social Networks For Young Americans

While we continue to hear about Americans ages 12 to 24 fleeing Facebook for other apps like Snapchat, Vine or WhatsApp, the evidence just doesn't square up with the facts.

While it's true that Facebook usage in that age group is lower than before, the social network still has a commanding lead over any of its competitors.

Here's a chart by Statista based on data published by Edison Research and Triton Digital that shows just how much 12 to 24 year olds actually use each of the most popular social platforms now available.

This is vitally important if your audience is in this age group because your promotion has to go where your fans are.


You should follow me on Forbes for some insights on the new music business, Twitter and Facebook for daily news and updates on production and the music business.

Thursday, January 22, 2015

Putting Vinyl Sales Into Perspective

Vinyl gets a lot of hype these days and you have to admit that it's a great success story. Here's a format that's basically dead in the water that suddenly rises from the ashes to find new popularity. On top of that, it's been growing by about 20% every year for the last 5 years.

That said, below is a chart that puts vinyl sales into perspective. It shows what sales were at their peak, and what they are now on the rebound. Many thanks to Paul Resnikoff at Digital Music News (you should read it).


Tuesday, December 23, 2014

The Music Royalty Ecosystem

If you ever wondered why an artist with a massive number of views or streams (or even sales for that matter) is receiving what seems to be a pittance in royalty payouts, then this overview infographic from Music Reports of the royalty payment infrastructure might explain it.

At the very top of the graphic is all the potential sources of income from digital, while the very bottom shows all the potential revenue sources from analog. Take notice how few lines actually lead to the performer or songwriter. There are a lot of fingers in the payment pie and unfortunately the artist's are the smallest.

This is one of the reasons why it's so attractive for an artist to go DIY, yet the real problem is you still need the infrastructure of a record label and publisher in order to get any traction, especially if you're a new artist. This is a dilemma that will continue to vex artists for a long time, I'm afraid.

That said, the graphic is very instructive and worth a minute or two of study.

Wednesday, December 17, 2014

The Highest Paid Musicians Of 2014

When it comes to making money, it sure helps if a musician has another source of revenue besides royalties, touring, merch sales and licensing.

Take the case of Dr. Dre, who made more money than any musician in history last year on the basis of his interest in Beats Electronics, which was purchased by Apple for $3 billion. As a result, Dre comes in at #1 of the highest paid musicians with $620 million, according to the following chart by Statista.

Some familiar faces fill out the rest of the top 10, but relative newcomers Justin Bieber, One Direction, Calvin Harris and Toby Keith all had banner years.

Notice who's not on the chart - Taylor Swift, Lady Gaga, and Katy Perry, among other current stars.


Monday, October 27, 2014

What Smart People Listen To

Here's an interesting chart the looks at what people listen to based on their college SAT scores. Basically, if you have a really high score than you probably listen to Beethoven, if it's moderately high it's Sufjan Stevens, Counting Crows, U2 and Radiohead. If it's on the low side, then you tend to listen more to hip hop, pop and rock. One of the more surprising parts of the chart is that jazz is pretty low on the "smart scale." We always think of the genre as more cerebral, but the chart doesn't bare that out.


----------------------------------

Thursday, September 11, 2014

The Top 10 Apps In The US

Music apps are very popular these days, but it comes as a little bit of a surprise that only one true music app (Pandora) and two apps that are used for music a lot but not exclusively (YouTube and Google Play) are in the top 10 in the US at the moment, according to this graphic by Statista based on data from Comscore.

Perhaps the biggest surprise is that Google Search is not #1, and that two map apps (Google Maps and Apple Maps) rank so high. That said, the chances are good that a new and different music app breaks into the top 10 at this time next year. Care to speculate on which one?

Top 10 apps in the US image

----------------------------------

Tuesday, August 12, 2014

The Millennial's Choice For Social Networks

Millennials love their smartphones and they love their social networks. Here's an interesting Statista infographic derived from comScore and Mobile Metrix info that shows their most popular social networks while using their phones.

What's interesting is that Facebook is still the number 1 choice by far, followed by Instagram and Snapchat. Now you can see why Snapchat turned down a $3 billion acquisition offer from Facebook last year.

What this chart tells artists, bands and musicians is that no matter how badly you feel treated on Facebook, don't give up on it yet. It can still be a powerful marketing tool if you know how to use it.

----------------------------------

LinkWithin

Related Posts Plugin for WordPress, Blogger...